

Understanding your content analytics, drawing insights, and generating insightful reports on how your content is performing will help you turn your writing side hustle into a content business.
Comprehensive Content Analytics and Reporting.
To get started, Contentre currently has more than 6 analytics and charts to represent your freelance writing business performances.
Nevertheless, we are still experimenting, evolving, and developing more charts as we do more research.
So you don’t want to miss understanding these charts. In fact, your understanding of these analytics will give you useful insights into your writing business growth.
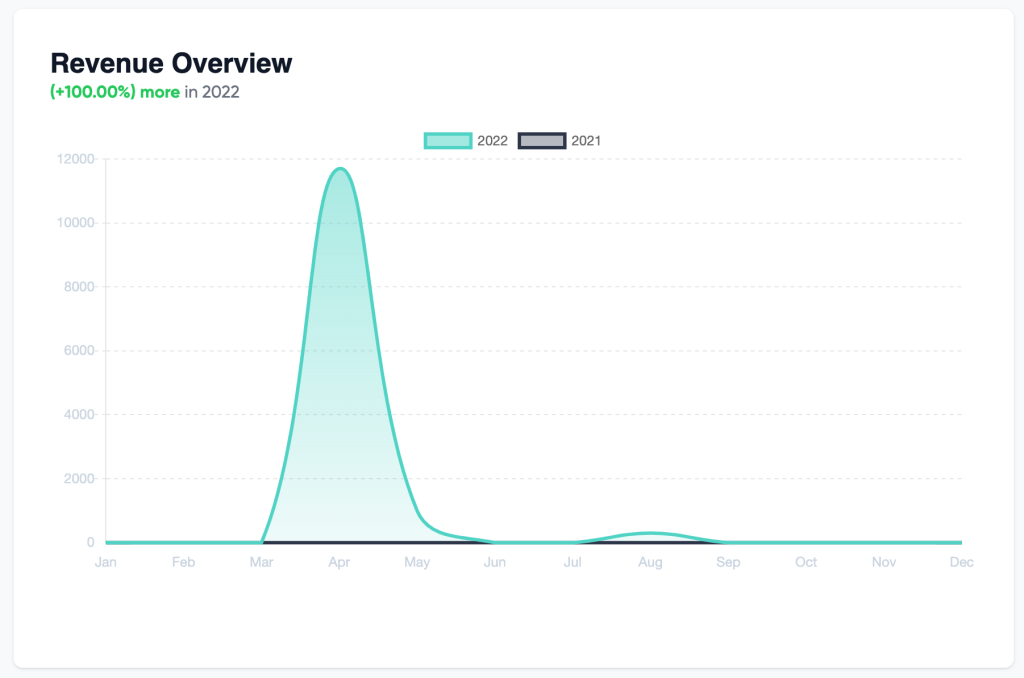
Revenue Overview
This chart is the first chart you see when you log in to your Contentre dashboard, it shows your Year Over Year Revenue Overview. As you add more content and indicate how much you generate from that content or how much your client paid you. The chart aggregates it and shows your profits or loss margin year over year.
There are a lot more insights to gain from this chart, you can understand at a glance if your writing business is profitable or not. You can see how much you made last year compared to the current year and in what month you made the highest income.
This video below shows all the analytics currently available for you in the Analytics tab.
In the video, we’ve:

Content Overview
This chart shows your Year Over Year Content Overview and can be filtered by date range to show MoM, WoW, or DoD and you can combine other filtering options.
Client Overview
This chart shows your Year Over Year Client Overview and can be filtered by date range to show MoM, WoW, or DoD and you can combine other filtering options.
Top Grouping
This chart shows your Year Over Year grouping Overview for your categories, tags, and topics(niches) and can be filtered by date range to show MoM, WoW, or DoD and you can combine other filtering options.
Overall Stats
This chart gives you a breakdown of your business performance and growth rate. It can be filtered by date range to show MoM, WoW, or DoD and you can combine other filtering options.
Was this article helpful? Let’s know in the comment section below.

Contentre helps technical writers stay organized and gain more clients. Grow your technical writing career in one place.
Now that you’re here, let me briefly recap the most important features Contentre can offer you:
- Organize your content in categories, topics, and tags
- Create and manage multiple clients
- Create and manage multiple personalized portfolios
- Get statistical analytics of your content revenue, top categories, and tags.